Earth Sciences - Eva Varga - Page 4


September 18, 201414

modeling plate tectonicsThe theory of plate tectonics provides geology with a comprehensive theory that explains how the Earth works. Though Alfred Wegener was the first to suggest the theory of continental drift and plate tectonics in 1915, it wasn’t widely accepted until the 1960s and 1970s as new information was obtained about the nature of the ocean floor, Earth’s magnetism, the distribution of volcanoes and earthquakes, the flow of heat from Earth’s interior, and the worldwide distribution of plant and animal fossils.

The theory of plate tectonics states that the Earth’s lithosphere is broken into 15 major plates.  Seven large plates include: the African, North American, South American, Eurasian, Australian, Antarctic, and Pacific plates. Several minor plates also exist, including the Arabian, Nazca, and Philippines plates.

These plates are all moving in different directions and at different speeds (from 2 cm to 10 cm per year–about the speed at which your fingernails grow) in relationship to each other atop the hot plastic upper mantle, known as the asthenosphere. These plates are in motion as a result of convection in the asthenosphere, creating a variety of interactions at the plate boundaries. At the plate boundaries, plates may converge (collide), diverge (separate), or slide past each other (transform boundary).  In addition, some plates may appear to be inactive.

In this simple activity, students will model each of the different types of interactions at plate boundaries. Each pair of students will need the following materials:

4 squares of graham crackers
1/2 rice cake
4 dollops of frosting
a small dish of water
spoon
paper plate

Part 1: Divergent Plate Boundaries

Procedure
1.  Divide your plate into four sections with a marker
2.  Place a dollop of frosting in each quadrant
3.  Lay the two pieces of graham cracker side by side on top of the frosting so they are touching.
4.  To imitate the result of diverging oceanic plates, press down on the crackers as you slowly pull apart in opposite directions.

Think About It
1.  What do the graham crackers represent?
2.  What does the frosting represent?
3.  What happened to the frosting between the crackers?
4.  Name a specific location on the Earth where this kind of boundary activity takes place.
5.  What type of feature is produced by this movement?
6.  What is the process called that creates new ocean floor from diverging plates?

Part 2: Convergent Plate Boundaries (Oceanic & Continental –> Subduction)

Procedure
1.  Take another graham cracker (to represent the thin but dense oceanic plate) and lay it next to a rice cake (to represent the thicker but less dense continental plate) so they are almost touching, end to end.
2.  Push the two “plates” slowly toward each other and observe which plate rides up over the other. On the actual surface of the Earth, the oceanic plate is subducted.

Think About It
1.  Why does the oceanic plate sink beneath the continental plate?
2.  Name a specific location on the Earth where this kind of boundary activity takes place.  Look at the attached plate tectonics diagram for help.
3.  What features are formed on the continent along this boundary?
4.  What feature is formed in the ocean along the subduction zone?

plateboundariesPart 3: Convergent Plate Boundaries (Continental –> Mountains)

Procedure
1. Take two new graham crackers. Each piece of graham cracker represents a continental plate.
2. Dip one end of each of the two graham crackers into a cup of water. Don’t wait too long or they will fall apart.
3. Immediately remove the crackers and lay them end to end on the frosting with the wet edges nearly touching.
4. Slowly push the two crackers together.

Think About It
1. What happens to the wet ends of the graham crackers?
2. What feature do the resulting ends of the wet crackers represent?
3. Name a specific location on the Earth where this type of boundary activity takes place. Look at the plate tectonics diagram for help.

Part 4: Transform Plate Boundaries (Sliding)

Procedure
1. Take two graham cracker pieces and lay the two pieces side by side on top of the frosting so they are touching.
2. Place one hand on each of the graham cracker pieces and push them together by applying steady, moderate pressure. At the same time, also push one of the pieces away from you while pulling the other toward you.

* If you do this correctly, the cracker should hold while you increase the push-pull pressure, but will finally break from the opposite forces. We found this one the most difficult to model accurately. 

Think About It
1. Name a specific location on the Earth where this type of boundary activity takes place. Look at the attached plate tectonics diagram for help.
2. Nothing happens at the beginning, but as the pressure is increased, the crackers finally break. What do we call the breaking and vibrating of the Earth’s crust?
3. Why do you think Earthquakes typically occur in California and not in the midwest?


September 11, 20144

In addition to the lessons I presented on Earth’s interior and surface topography described last week, I also taught a short lesson on Geospheres and our Earth System. To those who had explored ecology with us in the spring, this was a bit of review though the material was presented in a different manner.

What is a System?

A system is generally described as a set of components that interact within a boundary. A clock is a good example of a system. Mechanical and often electrical components work together to display the time. In recent years, scientists have started to consider Earth, from the very top of the atmosphere to the core at its center, as a system with four major components or spheres that interact in very complex ways.

geospheres

Geospheres

The area near the surface of the earth can be divided up into four inter-connected “geo-spheres:” the lithosphere, hydrosphere, biosphere, and atmosphere. Scientists can classify life and material on or near the surface of the earth to be in any of these four spheres. The names of the four spheres are derived from the Greek words for stone (litho), air (atmo), water (hydro), and life (bio).

  • The geosphere (sometimes called the lithosphere) includes the solid part of Earth, the interior, and the pedosphere, which is the thin, outermost soil layer.
  • The hydrosphere is all of Earth’s bodies of water, including groundwater and Earth’s frozen water (the cryosphere).
  • The biosphere is all living things, plants and animals, from microbes to humans.
  • The atmosphere is the blanket of gas that surrounds Earth, and includes the precipitation, clouds, and aerosols (tiny suspended particles) that are found in air.
In STEM Club, we focused on spheres that are most accessible to students: the portion of the geosphere called the pedosphere; the hydrosphere; the biosphere; and the atmosphere.

Beginning to perceive Earth as a system can begin with something as simple as when we first feel warmth from sunshine or get wet standing in the rain. However, truly understanding Earth as a system requires a quantitative exploration of the connections among all parts of the system: air, water, land, and life.

At any moment in time, all matter and energy on Earth is part of one or more of these spheres, and across time, all of Earth’s matter cycles through two or more of these spheres.

annotated geospheresInterconnections and Processes

There are many simple examples of the interconnections between components and elements of the Earth system. I’ve listed a few here:

  • The roots of plants (biosphere) draw water and nutrients from the pedosphere, exchange oxygen and carbon dioxide with the atmosphere through the process of photosynthesis, and send water into the atmosphere through the process of transpiration.
  • Plants also die and decompose to become part of the pedosphere.
  • Water evaporates from rivers (hydrosphere) and the soil (pedosphere) to become part of the atmosphere.
  • Oxygen in the atmosphere dissolves in a river (hydrosphere).
  • Fish (biosphere) draw dissolved oxygen into their bodies from the hydrosphere.
  • The sun warms the pedosphere, which transfers its heat to the atmosphere.
  • Warmed air transfers heat to cooler land surfaces.
  • Evaporation from a lake (hydrosphere) transfers heat to the atmosphere.
  • Rivers and ocean currents redistribute heat energy.
  • Precipitation can warm or cool the pedosphere on which it falls.

There are also connections between elements within a component of the earth systems.  For example:

  • Birds eat plant seeds.
  • Flowers attract insects and other pollinators.
  • Rivers flow into lakes or oceans.

Because of the interconnectedness, changes in one sphere bring about changes in the others. Sometimes these changes are dramatic, but more frequently these changes are more subtle.

  • Droughts (atmosphere) can cause severe changes in the hydrosphere, the biosphere, and the pedosphere.
  • Rain changes the soil moisture and the amount of water in lakes and rivers.
  • Increased water level in a lake has an impact on the plants and animals that inhabit the shoreline.
  • An increase in air temperature decreases the amount of moisture in the pedosphere by increasing the rate of evaporation and the rate at which vegetation loses water (transpiration) to the atmosphere.

Class Activities

Lesson Objective – By studying the flow of energy and matter locally, students will begin to build an understanding of how the four components of the Earth system work together to create and maintain Earth’s unique climate.

Last week, I shared with the class a powerpoint from Earth Labs and then assigned them the task of taking a photograph for this week’s lesson. The photo could be of their backyard, the lake, the river, or a park – it was entirely up to them.

I opened today’s lesson by sharing with them several infographics that illustrated the cycles of water and nutrients between the spheres: the hydrologic cycle (water cycle), the carbon cycle (photosynthesis, respiration, and transpiration), the nitrogen cycle, etc. Most of this was review for the students – but for some it was new material.

I modeled for the class the process of identifying the interconnections and processes evident in the photograph I took (example pictured above). I then asked students to annotate a photograph of their study site.

Lastly, the students created a simplified diagram of their study site to highlight the flow of energy and matter among the four components of the Earth system.

geospheres

If you are interested in doing this lesson with your students, the printables and handouts are available as a FREE download, Geospheres Foldable. 


June 11, 2012

Orienteering is a sport that requires skills using a map and compass to navigate from point to point in diverse and usually unfamiliar terrain, and normally moving at speed. Participants are given a topographical map which they use to find control points.  Originally a training exercise in land navigation for the military, orienteering has developed many variations.
Orienteering began in the late 19th century in Sweden.  The actual term “orientering” (the original Swedish name for orienteering) was first used in 1886 and meant the crossing of unknown land with the aid of a map and a compass. In Sweden, orienteering grew into a competitive sport for military officers, then for civilians. The name is derived from a word root meaning to find the direction or location. The first orienteering competition open to the public was held in Norway in 1897.  Barnesklubb met last week for an introduction to the sport of Orienteering.  A simple pentagonal course was set up in a local park and the kids were given instruction on how to navigate using the compass.  The points were clearly visible and at each, a ‘clue word’ was recorded.  When the kids completed a four-point course, the words completed a sentence. This lesson is provided in my earth science curriculum, Earth Logic:  Our Dynamic Earth. It can also be purchased individually.

We are excited to take part in more elaborate Orienteering courses in the future. Perhaps you’ll join us?


January 23, 20101

Last week, we read a few introductory selections about weather and narrowed our focus to wind as it happened to correspond to our poetry selection, Robert Frost’s Now Close the Windows.  We then spent a few hours (over the course of a couple days) engaging in a few inquiry lessons to learn more about wind.  Read on to learn more about air pressure and wind activities in which we took part.

I began by asking, “Does air have weight?” They both said yes.

I then asked, “What is wind?” Sweetie replied, “Wind is oxygen and other chemicals. A little bit of dust and stuff, too.”

“Does dust have weight?” I asked. “A tiny bit,” she replied. “How about oxygen and other chemicals?” I inquired further. She said, “No.”

“Okay then, if dust has a tiny bit of weight. Does air have weight?” This time she responded, “Yeah. A little bit.”

We then set up a little experiment with a balance scale made of 2 meter sticks, some string, and 2 balloons. I blew up each of the balloons and they assured me that they were the same size and had the same amount of air inside (more or less). We then tied them to the strings on opposing ends of the stick so they would balance.

As the kids sketched the set-up, I asked them to predict or make an hypothesis about what would happen if I were to poke a hole in one balloon. They both stated that the air would go out but neither inferred that this would cause the balance scale to tip.

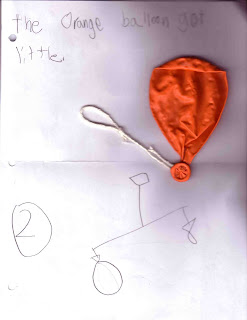
We proceeded and they were delighted to see that though the action was slow (it was a small hole), the orange balloon gradually got smaller and the blue balloon got closer to the ground (gravitational pull). I then asked that they record their observations in words or pictures. [Sweetie’s observation and sketch of the results is shown below with the orange balloon.]

Thereafter, I blew up another balloon but did not tie it closed. We then hypothesized what would happen when we let go of the balloon. Of course, they had had some prior experience with this so they both said, “It will sound like a fart and fly all around!” [I chuckled at that…]

I released the balloon and I then asked them to explain what had happened. “What caused the balloon to zip around like that?” Buddy said, “They air went out!” I then explained, “As we blew up the balloons, we forced air into a small space. There wasn’t a lot of room inside the balloon so the air made the wall of the balloon stretch and get bigger. This created a lot of pressure inside the balloon. The pressure in the balloon was high. The pressure outside the balloon was low. When we let go, the high-pressure air inside escaped into the low-pressure air outside, resulting in a rush of air. Winds behave in the same way: air moves from areas of high pressure to areas of lower pressure. The larger the difference in air pressure from one area to another, the stronger the winds.” We then sketched this in our notebook as well. [Buddy’s sketch of part 2 is visible above.]

We also discussed fronts and air masses. We did a little experiment to answer the question, “What is heavier, hot air or cold air?” using a small jar of warm water (“Hong!” – the kids proclaimed in Korean) and an identical jar of cold water (“Chung!”). We covered the blue jar with an index card and carefully turned it over and placed it atop the red jar (mouth to mouth). While one child held onto the bottom jar, I removed the card. We observed the colder, heavier blue water sinking down into the warmer, lighter red water. We repeated the experiment another time, reversing the position of the jars. This time, the warmer red water stayed on top, though there was a little mixing of the two in the middle.

We discussed that in the same way as the jars of water, a cold air mass will push under a warm air mass to create a cold front. A warm air mass will climb over a colder air mass to form a warm front. Sweetie then completed a couple of worksheets on air currents and fronts. She also learned the difference between a sea breeze and a land breeze and of the cause, the Coriolis effect.

In addition, we also began to compile data on a chart to document our local weather. We continue to do so for 4 weeks and thereafter create graphs with the data that we collect. Click here if you’d like a copy of the chart we are using.